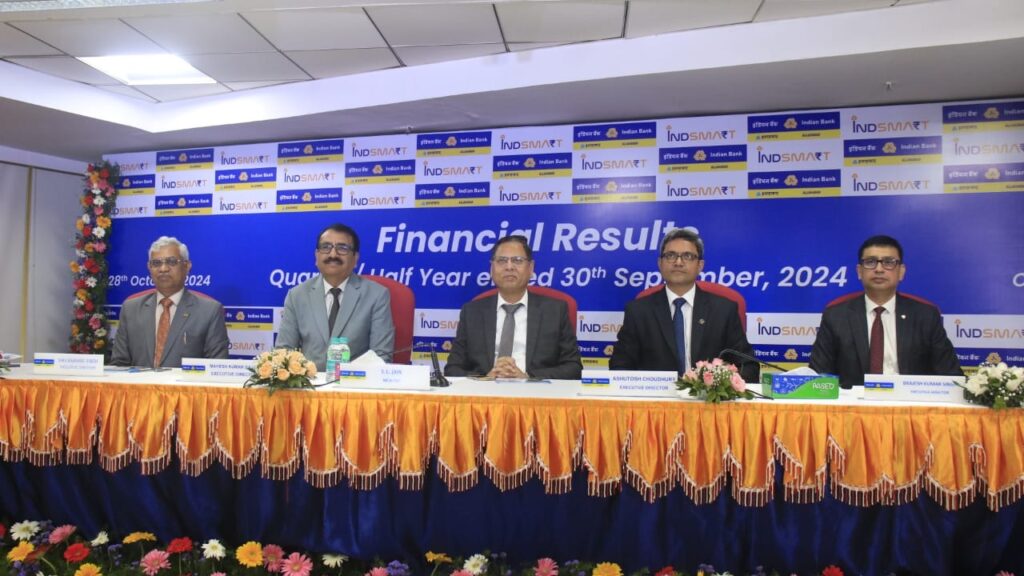
Key Highlights (Quarter ended Sep’24 over Sep’23)
Bank’s Global Business is at ₹12.44 lakh Cr, up by 10% YoY
• Net Profit up by 36% YoY at ₹2707 Cr in Sep’24 from ₹1988Cr in Sep’23
• Operating Profit improved by 10% YoY to ₹4728 Cr in Sep’24from ₹4303 Cr in Sep’23
• Net Interest Income increased by 8% YoY to ₹6194 Cr in Sep’24 from ₹5741 Cr in Sep’23
• Fee based income grew by 11% YoY to ₹891 Cr in Sep’24from ₹805 Cr in Sep’23
• Return on Assets (RoA) up by 27 bps to 1.33% in Sep’24from 1.06% in Sep’23
• Return on Equity (RoE) increased by 114 bps to 21.04% inSep’24 from 19.90% in Sep’23
• Yield on Advances (YoA) up by 2 bps to 8.77% in Sep’24 from 8.75% in Sep’23
• Yield on Investments (YoI) increased by 40 bps to 7.17% in Sep’24 from 6.77% in Sep’23
• Gross Advances increased by 12% YoY to ₹550644 Cr in Sep’24 from ₹492288 Cr in Sep’23
• RAM (Retail, Agriculture & MSME) advances grew by 14%YoY to ₹325050 Cr in Sep’24 from ₹285891 Cr in Sep’23
• RAM contribution to gross domestic advances stood at 63%. Retail, Agri & MSME advances grew by 15%, 16% and 8%YoY respectively. Home Loan (including mortgage) grew by 14% YoY in Sep’24
• Priority sector advances as a percentage of ANBC stood above 44% at ₹188348 Cr in Sep’24 as against the regulatory requirement of 40%
• Total Deposits increased by 8% YoY and reached to ₹693115Cr in Sep’24 as against ₹640803 Cr in Sep’23. Current, Savings & CASA deposits grew by 8%, 4%, and 5% YoYrespectively
• Domestic CASA ratio stood at 40.47% as on 30thSep’24
• CD ratio stood at 79% as on 30thSep’24
• GNPA decreased by 149 bps YoY to 3.48% in Sep’24 from 4.97% in Sep’23, NNPA reduced by 33 bps to 0.27% inSep’24 from 0.60% in Sep’23
• Provision Coverage Ratio (PCR, including TWO) improved by 196 bps YoY to 97.60% in Sep’24 from 95.64% in Sep’23
• Slippage Ratio contained to 1.06% in Sep’24 in comparison to 1.77% in Sep’23
• Capital Adequacy Ratio improved by 102 bps to 16.55%.CET-I improved by 144 bps YoY to 13.51%, Tier I Capitalimproved by 138 bps YoY to 14.01% in Sep’24
•
Key Highlights (Quarter ended Sep’24 over Jun’24)
Earnings Per Share (EPS) increased to ₹80.37 in Sep’24 from ₹63.84 in Sep’23
• Net Profit up by 13% QoQ to ₹2707 Cr in Sep’24 from ₹2403Cr in Jun’24
• Operating Profit improved by 5% QoQ to ₹4728 Cr in Sep’24from ₹4502 Cr in Jun’24
• Return on Assets (RoA) improved by 13 bps to 1.33% in Sep’24 from 1.20% in Jun’24
• Yield on Advances (YoA) improved by 8 bps to 8.77% in Sep’24 from 8.69% in Jun’24
• Yield on Investments (YoI) improved to 7.17% in Sep’24 from 7.15% in Jun’24
• GNPA decreased by 29 bps to 3.48% in Sep’24 from 3.77% inJun’24, NNPA reduced by 12 bps to 0.27% in Sep’24 from 0.39% in Jun’24
•
Smart Banking
Return on Equity (RoE) increased by 128 bps to 21.04% in Sep’24 from 19.76% in Jun’24
Key Highlights (Half Year ended Sep’24 over Sep’23)
• Net Profit up by 38% YoY to ₹5110 Cr in H1FY25 from ₹3697Cr in H1FY24
• Operating Profit increased by 9% YoY to ₹9230 Cr inH1FY25 from ₹8437 Cr
• Net Interest Income grew by 8% YoY to ₹12372 Cr inH1FY25 from ₹11444 Cr
• Net Interest Margin (NIM) Domestic stood at 3.51% in H1FY25
• Return on Assets (RoA) improved by 25 bps to 1.26% from 1.01% in H1FY24
• Return on Equity (RoE) increased by 148 bps to 20.38% from18.90% in H1FY24
• Cost-to-Income Ratio stood at 44.73% in H1FY25
Network:
• The Bank has 5856 domestic branches (including 3 DBUs), out of which 1983 are Rural, 1532 are Semi-Urban, 1174 are Urban & 1167 are in Metro category. The Bank has 3overseas branches & 1 IBU (Gift City Branch).
• The Bank has 5217 ATMs & BNAs and 12993 number of Business Correspondents (BCs).
Digital Banking:
• Business of ₹79,059 Cr has been generated through Digital Channels in H1FY25. A total of 102 Digital Journeys, Utilities and Processes have been launched so far.
• Number of Mobile Banking users has grown by 20% year over year, reaching 1.81 Cr.
• UPI users and Net Banking Users have seen a 27% & 13%YoY increase respectively, reaching 1.95 Cr and 1.11Cr respectively.
• The Credit Card users increased by 50% YoY to 2.65 lakh, while the total number of Point of Sale (PoS) terminals has increased by 56% YoY, reaching a total of 20,904.


More Stories
Agilisium Gifts Hyundai Creta Cars To All Its Long-Serving Employees
KICL launches slew of agro products
SPIN Chennai celebrates the Pearl jubilee-30years of excellence & innovation with organising a premier conference on AI